November Real Estate Market Update
Hello November! Its already fall and the holiday season is fast approaching! We went through a Fed Rate Cut and a few other Key Reports that have shown that the economy is still strong. Lets see how that has played out in the local Sarasota and Manatee real estate market.
First we always like to look at the number of new homes coming on the market.

So year to date we are down to less than 1% after a big increase in new listings in September , now remember this number will not take into consideration all the New Construction homes since they are not all listed for sale.
Next up lets take a look at the number of pending homes or the number of home that have gone into escrow.

We saw another strong increase in pending sales after the big upswing in August. Interest rates have remained low after they fell to near record lows in August. We have also seen FHA guidelines loosen up allowing more condo/townhomes purchases to qualify. Which is a great opportunity in the lower price-points.
Now lets take a look at Months Supply of Inventory. What this means is that if we sold every home available and no more inventory came on the market how long would that take.

Looks like inventory has stayed the same Year to Date. This number can be hyper-local as well as we have seen higher price points are holding alot more inventory. You should reach out to us if you would like some more granular data to your specific price point or neighborhood!
The median price is up 3.7% on the year, which is the amount that values have increased/decreased. This is good to consider if your thinking about selling and comparing prices to what you have seen.

The next two numbers we want to look at is the number of homes that are actually for sale, and how long is it taking for those homes to go into escrow.

So first the number of homes for sale has risen 1.6% on the year. With a total of 5095 homes for sale in Sarasota and Manatee County we are starting to see Condition and Price become more and more important. As inventory rises buyers have more homes to chose from and the homes with the best VALUE (Buyers perceive value as Price + Condition) will still move fast in this market.
So when you have more homes for sale naturally the time on market or days on market we call it. Which is how long does it take for a home to go on the market and then go into escrow.

So the time to contract is up 10.4% Year to Date to 53 days, this number too can be dialed in to specific neighborhoods and price points. However if your home has been sitting longer than 53 days you have to review the THE BIG TWO... Price and Condition.
I also wanted to include this to show the difference between price points in how quickly homes are selling
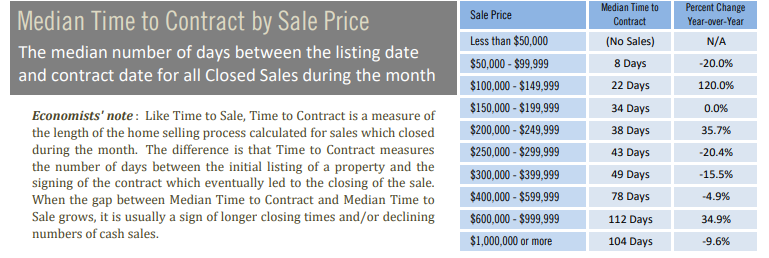
As you can see the higher the price point the longer homes are taking to sell. Why is that? It all has to do with supply and demand. Take a look at the next chart.
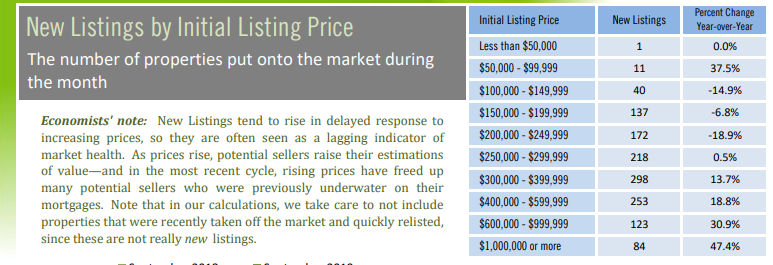
As you can see we have a glut of supply in the higher price points. Builders are continuing to build homes in the higher price points even though we can clearly see that there is massive demand in the $200 -$300 price range. So if you have a home to sell in these higher price ranges. Make sure you are keeping it in A1 shape, or pricing it to outpace any new construction you may be competing with.

Last but not least we have Closed Sales , with closed sales being up 5.6% for the year we have a strong indicator that the market is still going strong. With interest rates still near record lows and inventory remaining tight in certain price points it is a great market for both Buyers and Sellers.
Remember last month we had a huge boost in pending sales, now that number is reflected in Septembers huge uptick in closed sales.
If you have any questions or would like some more specific data on your home, neighborhood, or price point. Please do not hesitate to reach out!
